Column configuration
When working with data in Streamlit, the st.column_config class is a powerful tool for configuring data display and interaction. Specifically designed for the column_config parameter in st.dataframe and st.data_editor, it provides a suite of methods to tailor your columns to various data types - from simple text and numbers to lists, URLs, images, and more.
Whether it's translating temporal data into user-friendly formats or utilizing charts and progress bars for clearer data visualization, column configuration not only provides the user with an enriched data viewing experience but also ensures that you're equipped with the tools to present and interact with your data, just the way you want it.
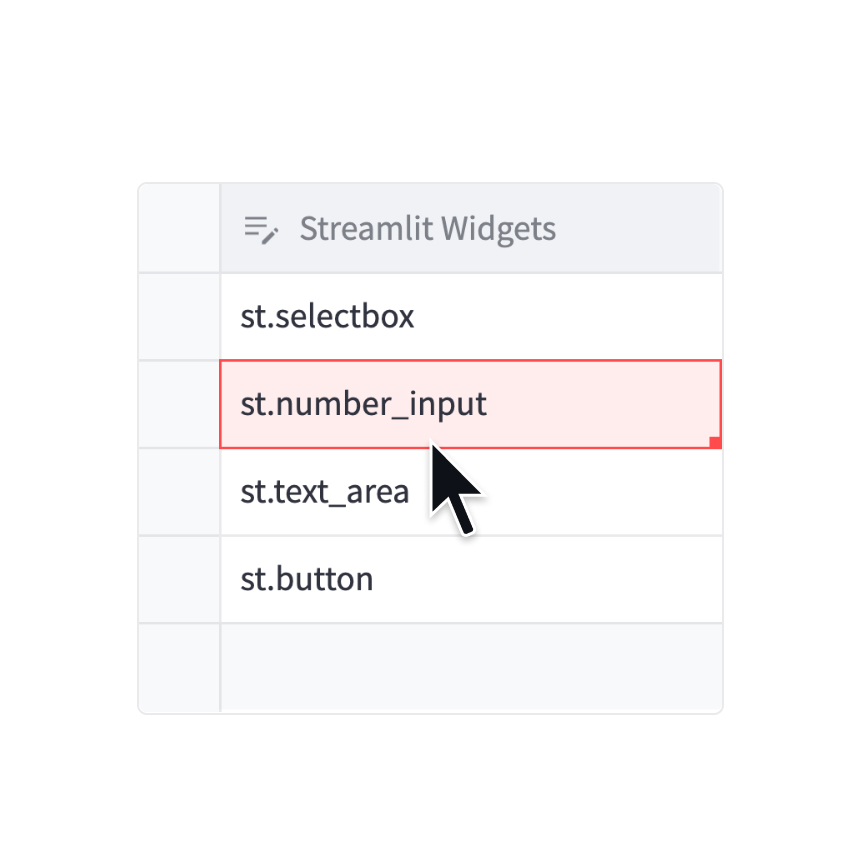
Column
Configure a generic column.
Column("Streamlit Widgets", width="medium", help="Streamlit **widget** commands 🎈")
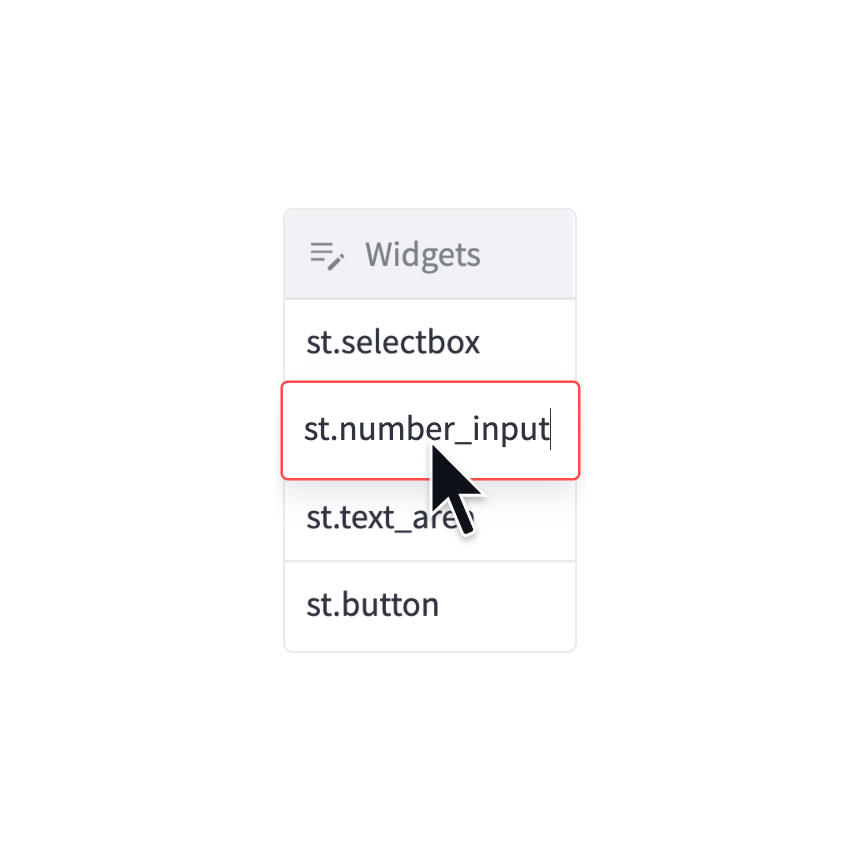
Text column
Configure a text column.
TextColumn("Widgets", max_chars=50, validate="^st\.[a-z_]+$")
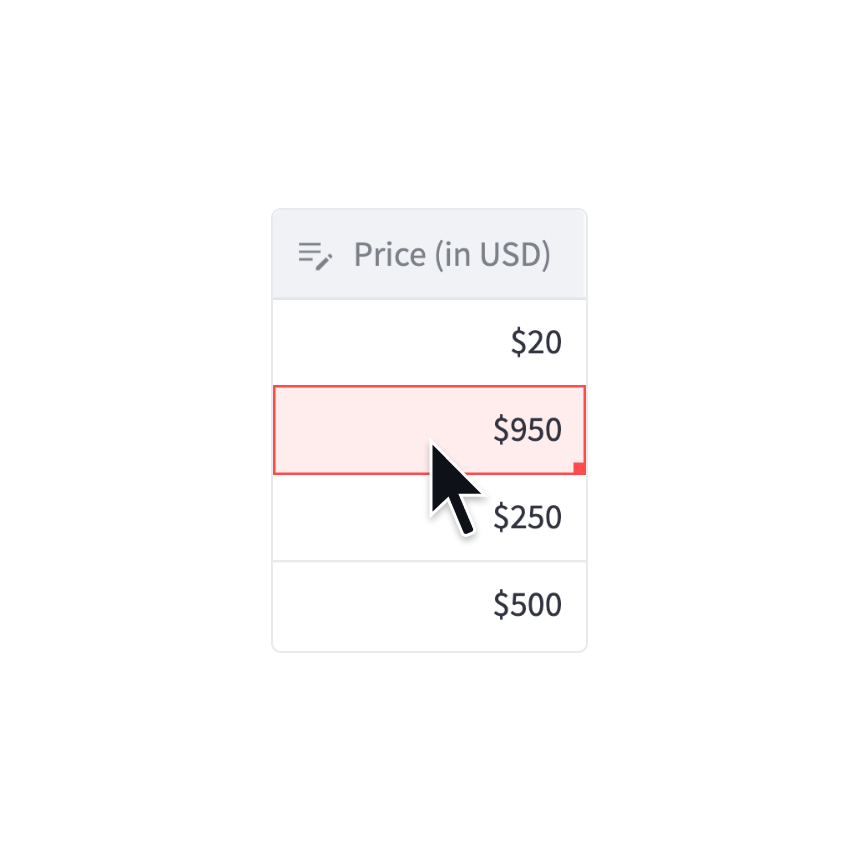
Number column
Configure a number column.
NumberColumn("Price (in USD)", min_value=0, format="$%d")
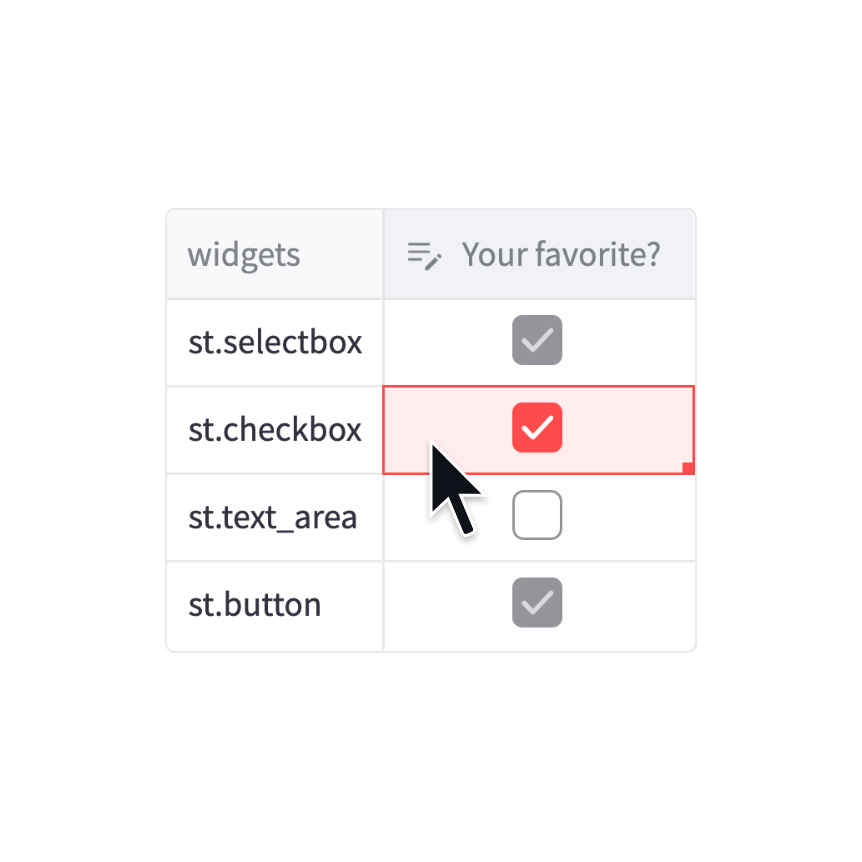
Checkbox column
Configure a checkbox column.
CheckboxColumn("Your favorite?", help="Select your **favorite** widgets")
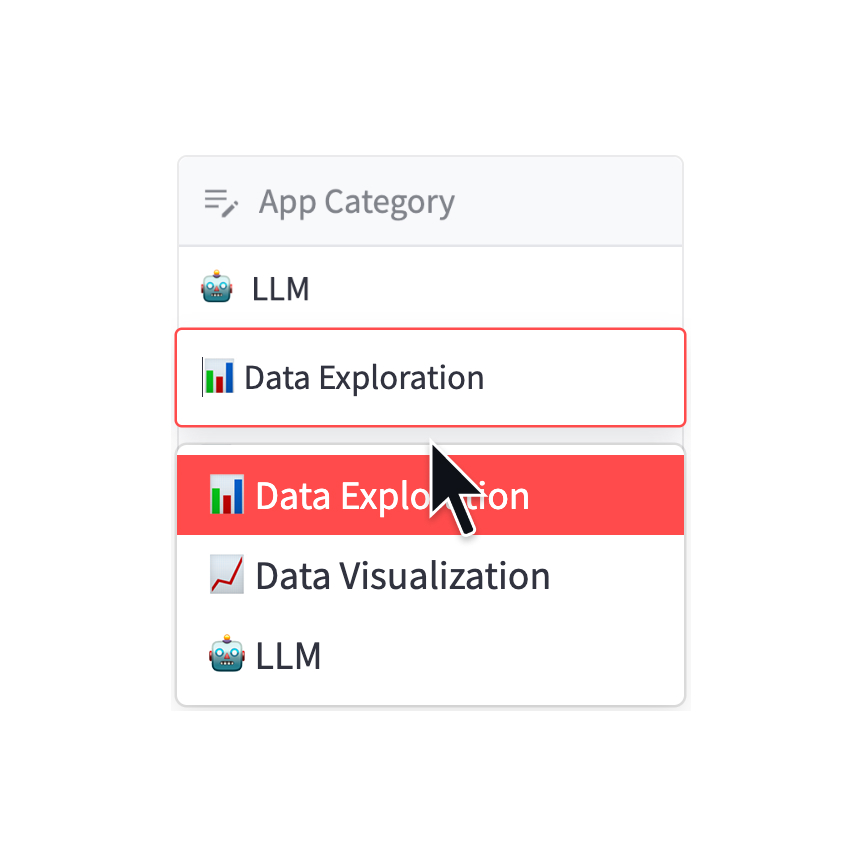
Selectbox column
Configure a selectbox column.
SelectboxColumn("App Category", options=["🤖 LLM", "📈 Data Viz"])
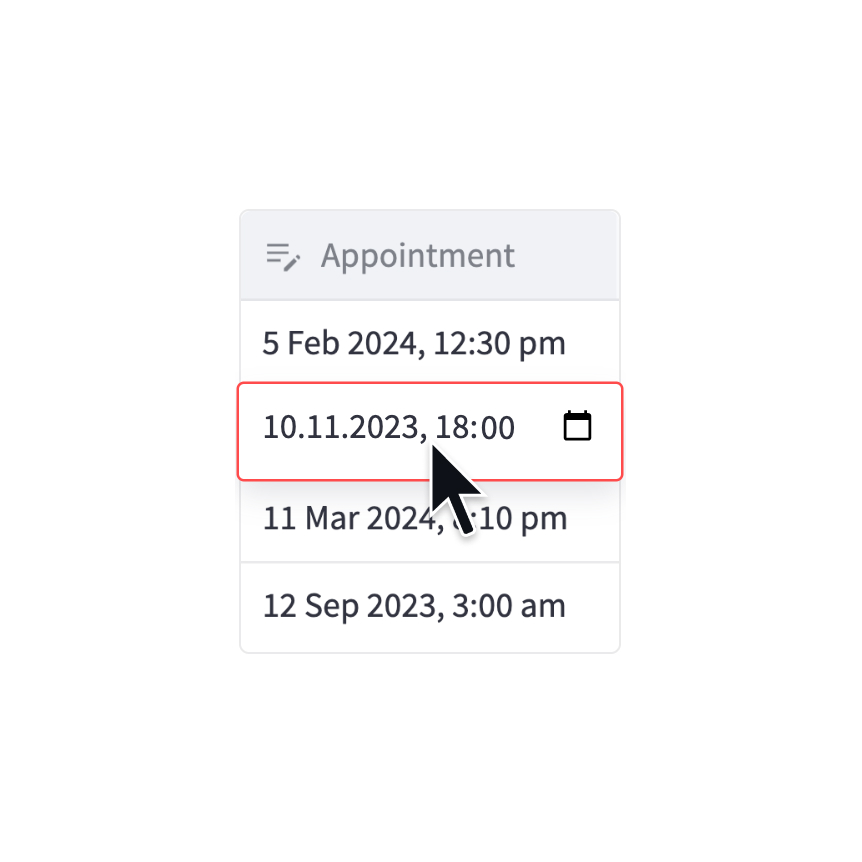
Datetime column
Configure a datetime column.
DatetimeColumn("Appointment", min_value=datetime(2023, 6, 1), format="D MMM YYYY, h:mm a")
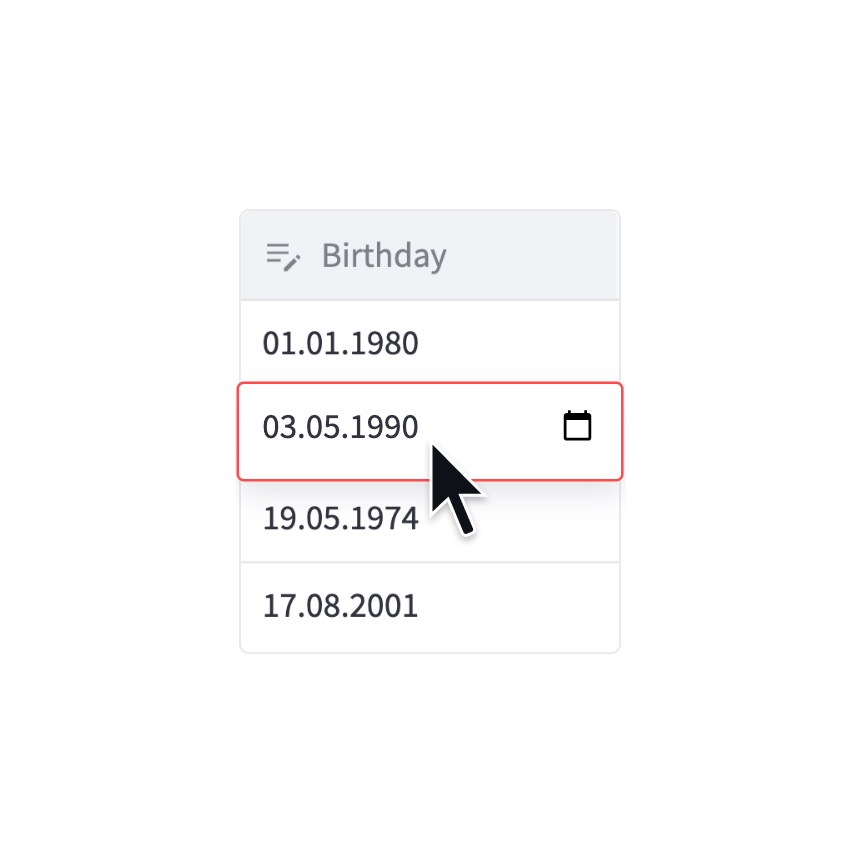
Date column
Configure a date column.
DateColumn("Birthday", max_value=date(2005, 1, 1), format="DD.MM.YYYY")
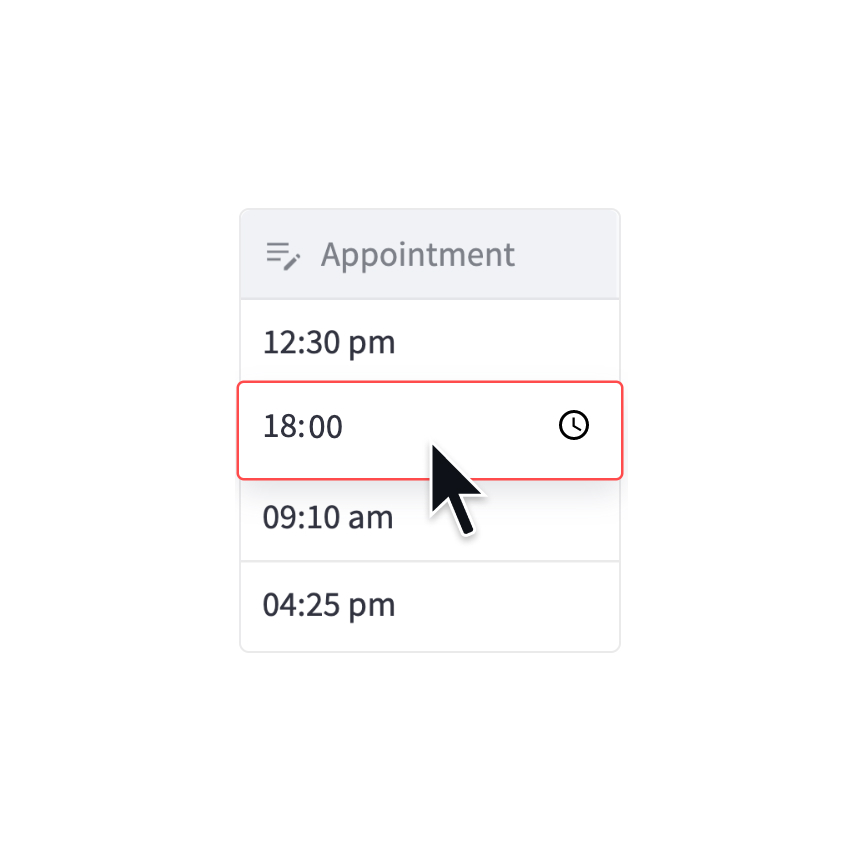
Time column
Configure a time column.
TimeColumn("Appointment", min_value=time(8, 0, 0), format="hh:mm a")
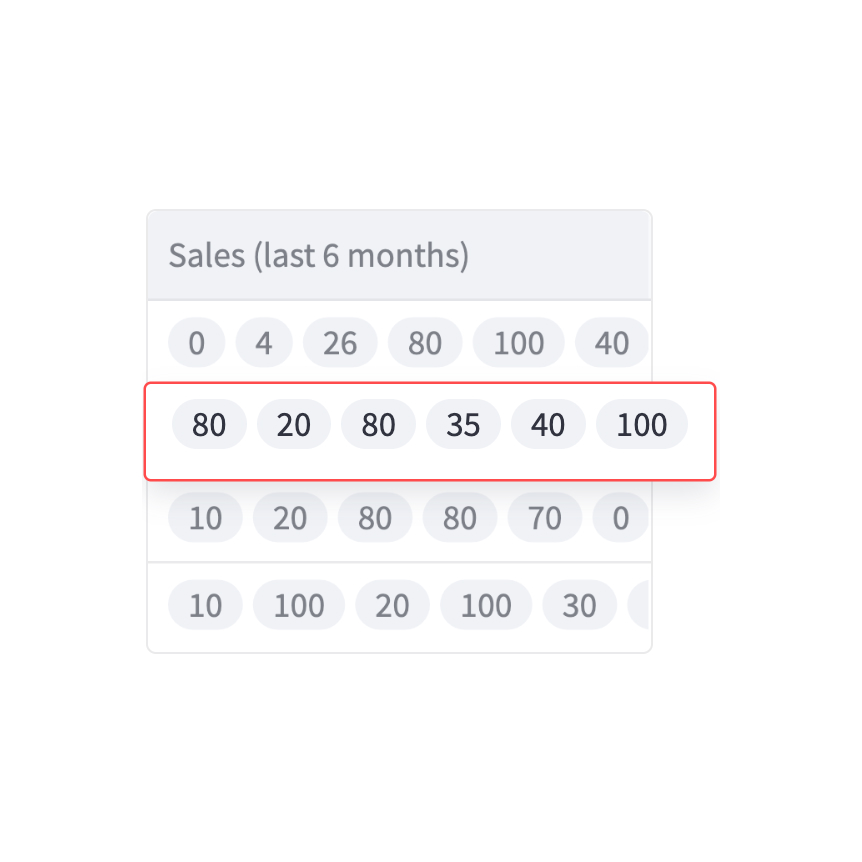
List column
Configure a list column.
ListColumn("Sales (last 6 months)", width="medium")
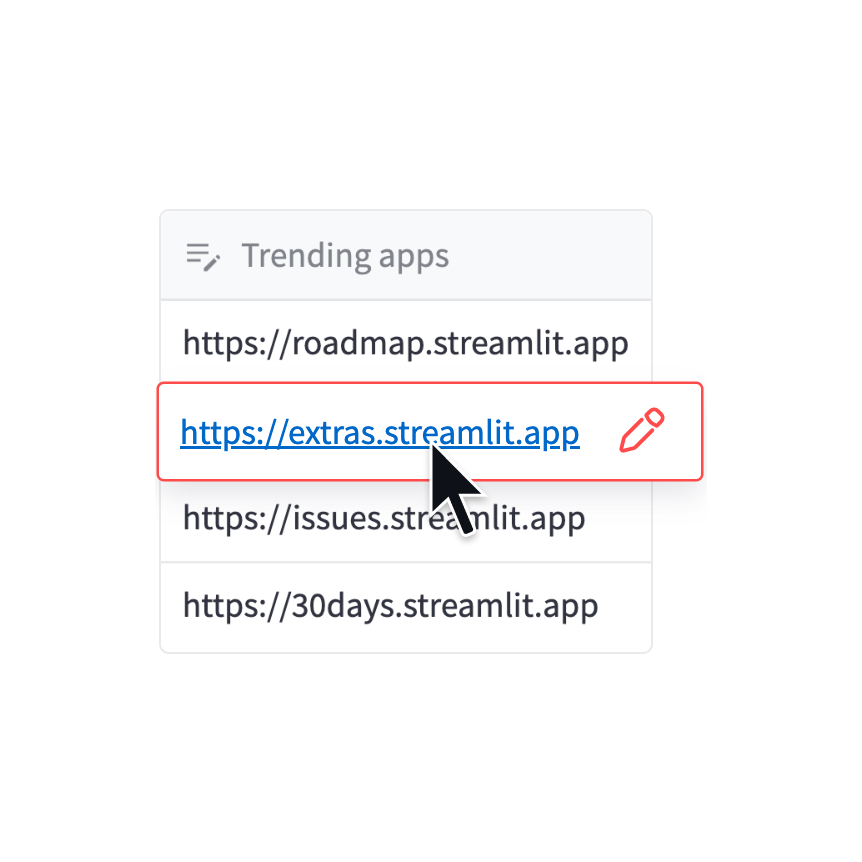
Link column
Configure a link column.
LinkColumn("Trending apps", max_chars=100, validate="^https://.*$")
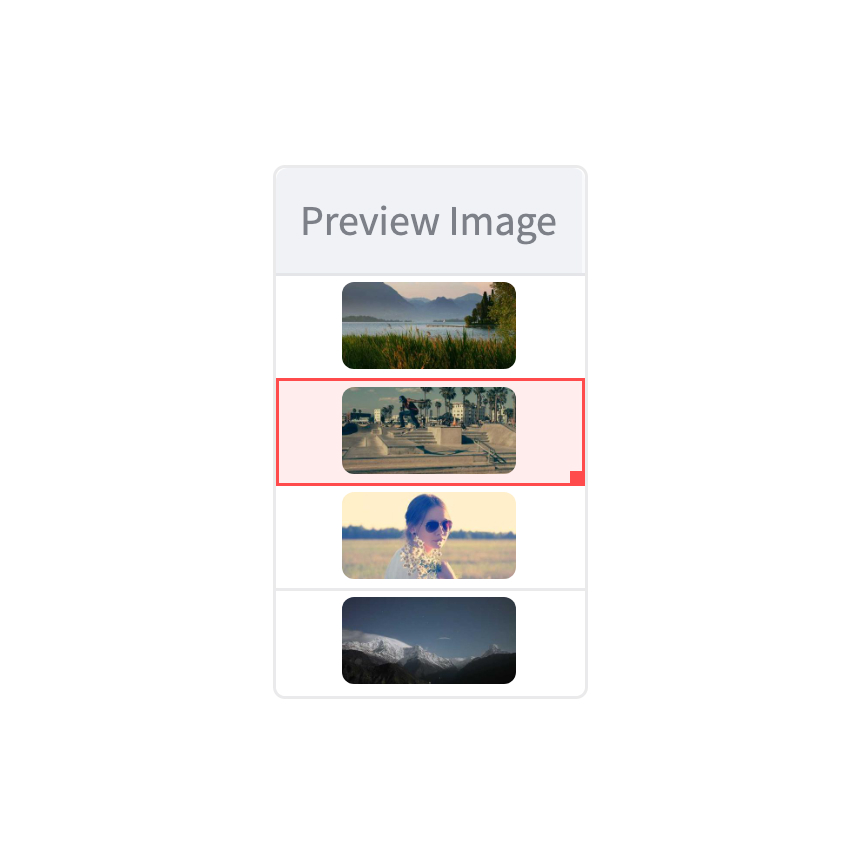
Image column
Configure an image column.
ImageColumn("Preview Image", help="The preview screenshots")
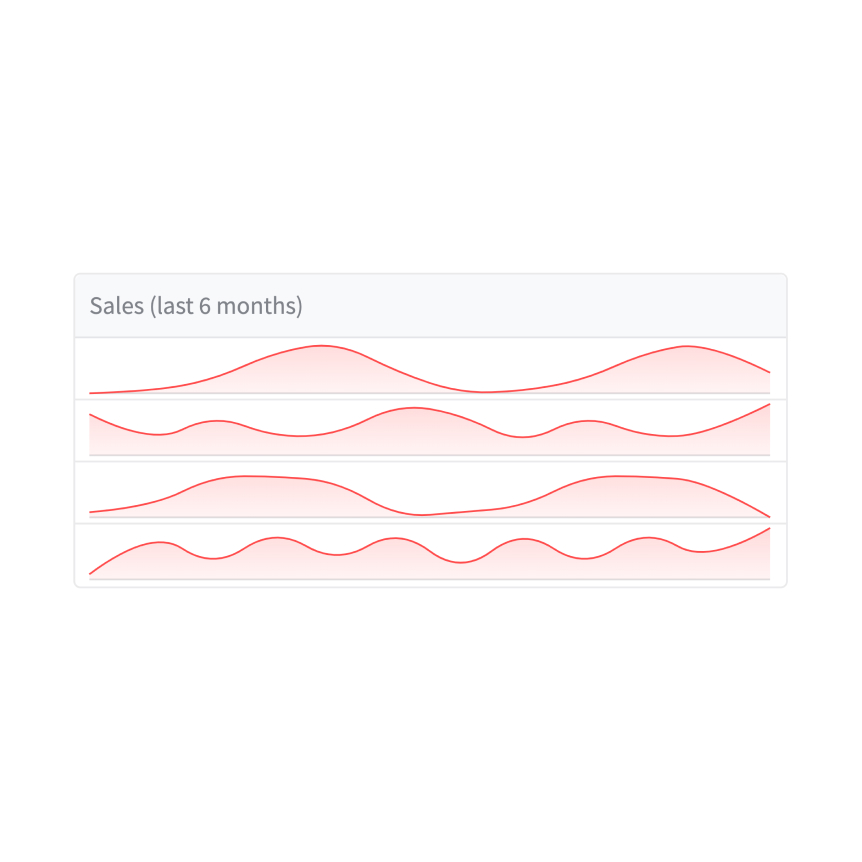
Area chart column
Configure an area chart column.
AreaChartColumn("Sales (last 6 months)" y_min=0, y_max=100)
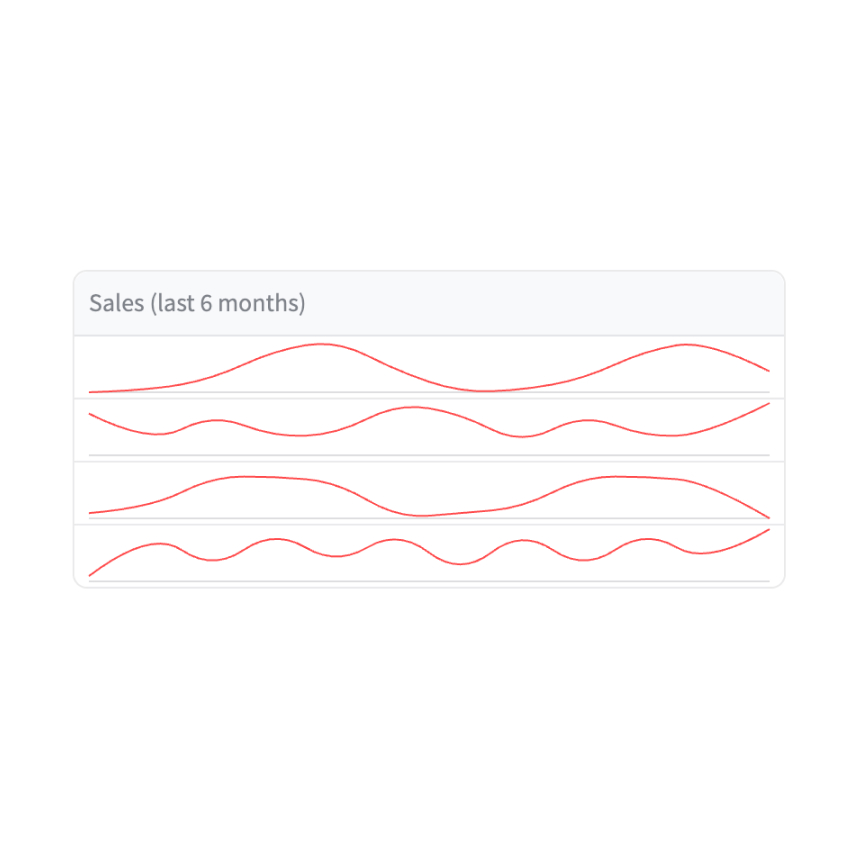
Line chart column
Configure a line chart column.
LineChartColumn("Sales (last 6 months)" y_min=0, y_max=100)
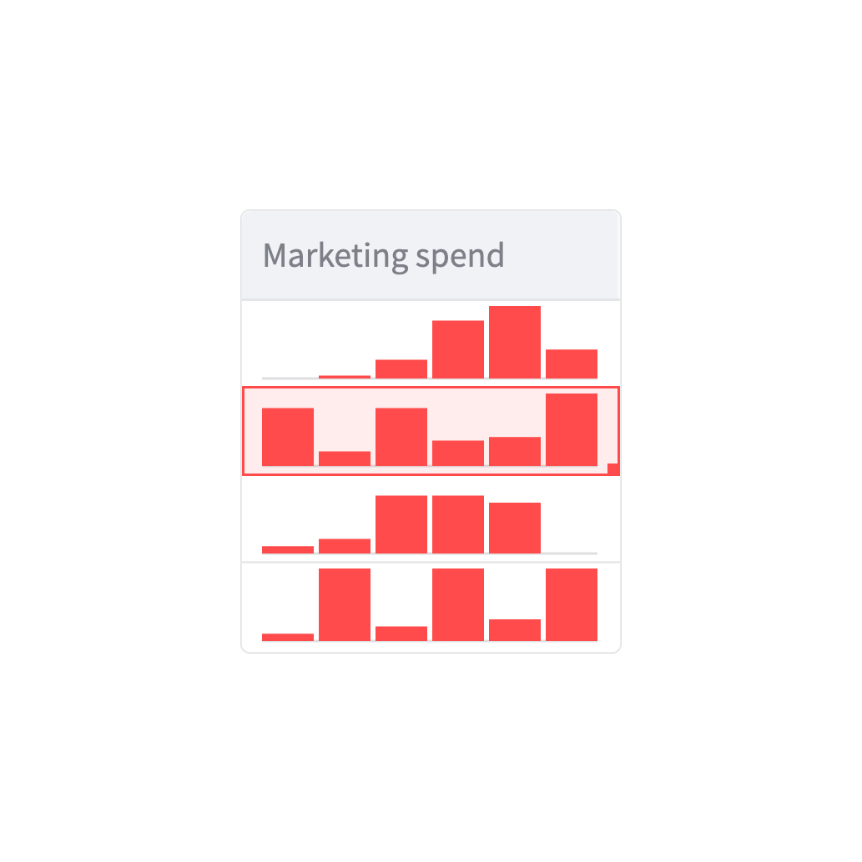
Bar chart column
Configure a bar chart column.
BarChartColumn("Marketing spend" y_min=0, y_max=100)
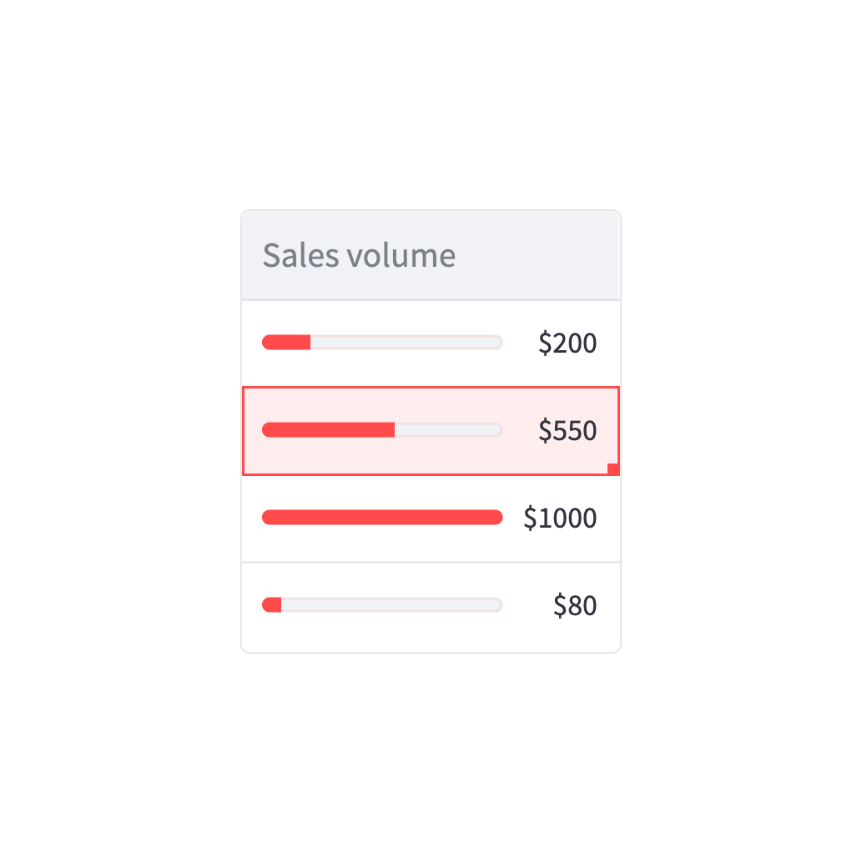
Progress column
Configure a progress column.
ProgressColumn("Sales volume", min_value=0, max_value=1000, format="$%f")
Still have questions?
Our forums are full of helpful information and Streamlit experts.