Create a multipage app
In Additional features, we introduced multipage apps, including how to define pages, structure and run multipage apps, and navigate between pages in the user interface. You can read more details in our guide to Multipage apps
In this guide, let’s put our understanding of multipage apps to use by converting the previous version of our streamlit hello app to a multipage app!
Motivation
Before Streamlit 1.10.0, the streamlit hello command was a large single-page app. As there was no support for multiple pages, we resorted to splitting the app's content using st.selectbox in the sidebar to choose what content to run. The content is comprised of three demos for plotting, mapping, and dataframes.
Here's what the code and single-page app looked like:
hello.py (👈 Toggle to expand)
import streamlit as st

def intro():
    import streamlit as st

    st.write("# Welcome to Streamlit! 👋")
    st.sidebar.success("Select a demo above.")

    st.markdown(
        """
        Streamlit is an open-source app framework built specifically for
        Machine Learning and Data Science projects.

        **👈 Select a demo from the dropdown on the left** to see some examples
        of what Streamlit can do!

        ### Want to learn more?

        - Check out [streamlit.io](https://streamlit.io)
        - Jump into our [documentation](https://docs.streamlit.io)
        - Ask a question in our [community
          forums](https://discuss.streamlit.io)

        ### See more complex demos

        - Use a neural net to [analyze the Udacity Self-driving Car Image
          Dataset](https://github.com/streamlit/demo-self-driving)
        - Explore a [New York City rideshare dataset](https://github.com/streamlit/demo-uber-nyc-pickups)
    """
    )

def mapping_demo():
    import streamlit as st
    import pandas as pd
    import pydeck as pdk

    from urllib.error import URLError

    st.markdown(f"# {list(page_names_to_funcs.keys())[2]}")
    st.write(
        """
        This demo shows how to use
[`st.pydeck_chart`](https://docs.streamlit.io/develop/api-reference/charts/st.pydeck_chart)
to display geospatial data.
"""
    )

    @st.cache_data
    def from_data_file(filename):
        url = (
            "http://raw.githubusercontent.com/streamlit/"
            "example-data/master/hello/v1/%s" % filename
        )
        return pd.read_json(url)

    try:
        ALL_LAYERS = {
            "Bike Rentals": pdk.Layer(
                "HexagonLayer",
                data=from_data_file("bike_rental_stats.json"),
                get_position=["lon", "lat"],
                radius=200,
                elevation_scale=4,
                elevation_range=[0, 1000],
                extruded=True,
            ),
            "Bart Stop Exits": pdk.Layer(
                "ScatterplotLayer",
                data=from_data_file("bart_stop_stats.json"),
                get_position=["lon", "lat"],
                get_color=[200, 30, 0, 160],
                get_radius="[exits]",
                radius_scale=0.05,
            ),
            "Bart Stop Names": pdk.Layer(
                "TextLayer",
                data=from_data_file("bart_stop_stats.json"),
                get_position=["lon", "lat"],
                get_text="name",
                get_color=[0, 0, 0, 200],
                get_size=15,
                get_alignment_baseline="'bottom'",
            ),
            "Outbound Flow": pdk.Layer(
                "ArcLayer",
                data=from_data_file("bart_path_stats.json"),
                get_source_position=["lon", "lat"],
                get_target_position=["lon2", "lat2"],
                get_source_color=[200, 30, 0, 160],
                get_target_color=[200, 30, 0, 160],
                auto_highlight=True,
                width_scale=0.0001,
                get_width="outbound",
                width_min_pixels=3,
                width_max_pixels=30,
            ),
        }
        st.sidebar.markdown("### Map Layers")
        selected_layers = [
            layer
            for layer_name, layer in ALL_LAYERS.items()
            if st.sidebar.checkbox(layer_name, True)
        ]
        if selected_layers:
            st.pydeck_chart(
                pdk.Deck(
                    map_style="mapbox://styles/mapbox/light-v9",
                    initial_view_state={
                        "latitude": 37.76,
                        "longitude": -122.4,
                        "zoom": 11,
                        "pitch": 50,
                    },
                    layers=selected_layers,
                )
            )
        else:
            st.error("Please choose at least one layer above.")
    except URLError as e:
        st.error(
            """
            **This demo requires internet access.**

            Connection error: %s
        """
            % e.reason
        )

def plotting_demo():
    import streamlit as st
    import time
    import numpy as np

    st.markdown(f'# {list(page_names_to_funcs.keys())[1]}')
    st.write(
        """
        This demo illustrates a combination of plotting and animation with
Streamlit. We're generating a bunch of random numbers in a loop for around
5 seconds. Enjoy!
"""
    )

    progress_bar = st.sidebar.progress(0)
    status_text = st.sidebar.empty()
    last_rows = np.random.randn(1, 1)
    chart = st.line_chart(last_rows)

    for i in range(1, 101):
        new_rows = last_rows[-1, :] + np.random.randn(5, 1).cumsum(axis=0)
        status_text.text("%i%% Complete" % i)
        chart.add_rows(new_rows)
        progress_bar.progress(i)
        last_rows = new_rows
        time.sleep(0.05)

    progress_bar.empty()

    # Streamlit widgets automatically run the script from top to bottom. Since
    # this button is not connected to any other logic, it just causes a plain
    # rerun.
    st.button("Re-run")


def data_frame_demo():
    import streamlit as st
    import pandas as pd
    import altair as alt

    from urllib.error import URLError

    st.markdown(f"# {list(page_names_to_funcs.keys())[3]}")
    st.write(
        """
        This demo shows how to use `st.write` to visualize Pandas DataFrames.

(Data courtesy of the [UN Data Explorer](http://data.un.org/Explorer.aspx).)
"""
    )

    @st.cache_data
    def get_UN_data():
        AWS_BUCKET_URL = "http://streamlit-demo-data.s3-us-west-2.amazonaws.com"
        df = pd.read_csv(AWS_BUCKET_URL + "/agri.csv.gz")
        return df.set_index("Region")

    try:
        df = get_UN_data()
        countries = st.multiselect(
            "Choose countries", list(df.index), ["China", "United States of America"]
        )
        if not countries:
            st.error("Please select at least one country.")
        else:
            data = df.loc[countries]
            data /= 1000000.0
            st.write("### Gross Agricultural Production ($B)", data.sort_index())

            data = data.T.reset_index()
            data = pd.melt(data, id_vars=["index"]).rename(
                columns={"index": "year", "value": "Gross Agricultural Product ($B)"}
            )
            chart = (
                alt.Chart(data)
                .mark_area(opacity=0.3)
                .encode(
                    x="year:T",
                    y=alt.Y("Gross Agricultural Product ($B):Q", stack=None),
                    color="Region:N",
                )
            )
            st.altair_chart(chart, use_container_width=True)
    except URLError as e:
        st.error(
            """
            **This demo requires internet access.**

            Connection error: %s
        """
            % e.reason
        )

page_names_to_funcs = {
    "—": intro,
    "Plotting Demo": plotting_demo,
    "Mapping Demo": mapping_demo,
    "DataFrame Demo": data_frame_demo
}

demo_name = st.sidebar.selectbox("Choose a demo", page_names_to_funcs.keys())
page_names_to_funcs[demo_name]()
Notice how large the file is! Each app “page" is written as a function, and the selectbox is used to pick which page to display. As our app grows, maintaining the code requires a lot of additional overhead. Moreover, we’re limited by the st.selectbox UI to choose which “page" to run, we cannot customize individual page titles with st.set_page_config, and we’re unable to navigate between pages using URLs.
Convert an existing app into a multipage app
Now that we've identified the limitations of a single-page app, what can we do about it? Armed with our knowledge from the previous section, we can convert the existing app to be a multipage app, of course! At a high level, we need to perform the following steps:
- Create a new
pagesfolder in the same folder where the “entrypoint file" (hello.py) lives - Rename our entrypoint file to
Hello.py, so that the title in the sidebar is capitalized - Create three new files inside of
pages:pages/1_📈_Plotting_Demo.pypages/2_🌍_Mapping_Demo.pypages/3_📊_DataFrame_Demo.py
- Move the contents of the
plotting_demo,mapping_demo, anddata_frame_demofunctions into their corresponding new files from Step 3 - Run
streamlit run Hello.pyto view your newly converted multipage app!
Now, let’s walk through each step of the process and view the corresponding changes in code.
Create the entrypoint file
Hello.py
import streamlit as st

st.set_page_config(
    page_title="Hello",
    page_icon="👋",
)

st.write("# Welcome to Streamlit! 👋")

st.sidebar.success("Select a demo above.")

st.markdown(
    """
    Streamlit is an open-source app framework built specifically for
    Machine Learning and Data Science projects.
    **👈 Select a demo from the sidebar** to see some examples
    of what Streamlit can do!
    ### Want to learn more?
    - Check out [streamlit.io](https://streamlit.io)
    - Jump into our [documentation](https://docs.streamlit.io)
    - Ask a question in our [community
        forums](https://discuss.streamlit.io)
    ### See more complex demos
    - Use a neural net to [analyze the Udacity Self-driving Car Image
        Dataset](https://github.com/streamlit/demo-self-driving)
    - Explore a [New York City rideshare dataset](https://github.com/streamlit/demo-uber-nyc-pickups)
"""
)
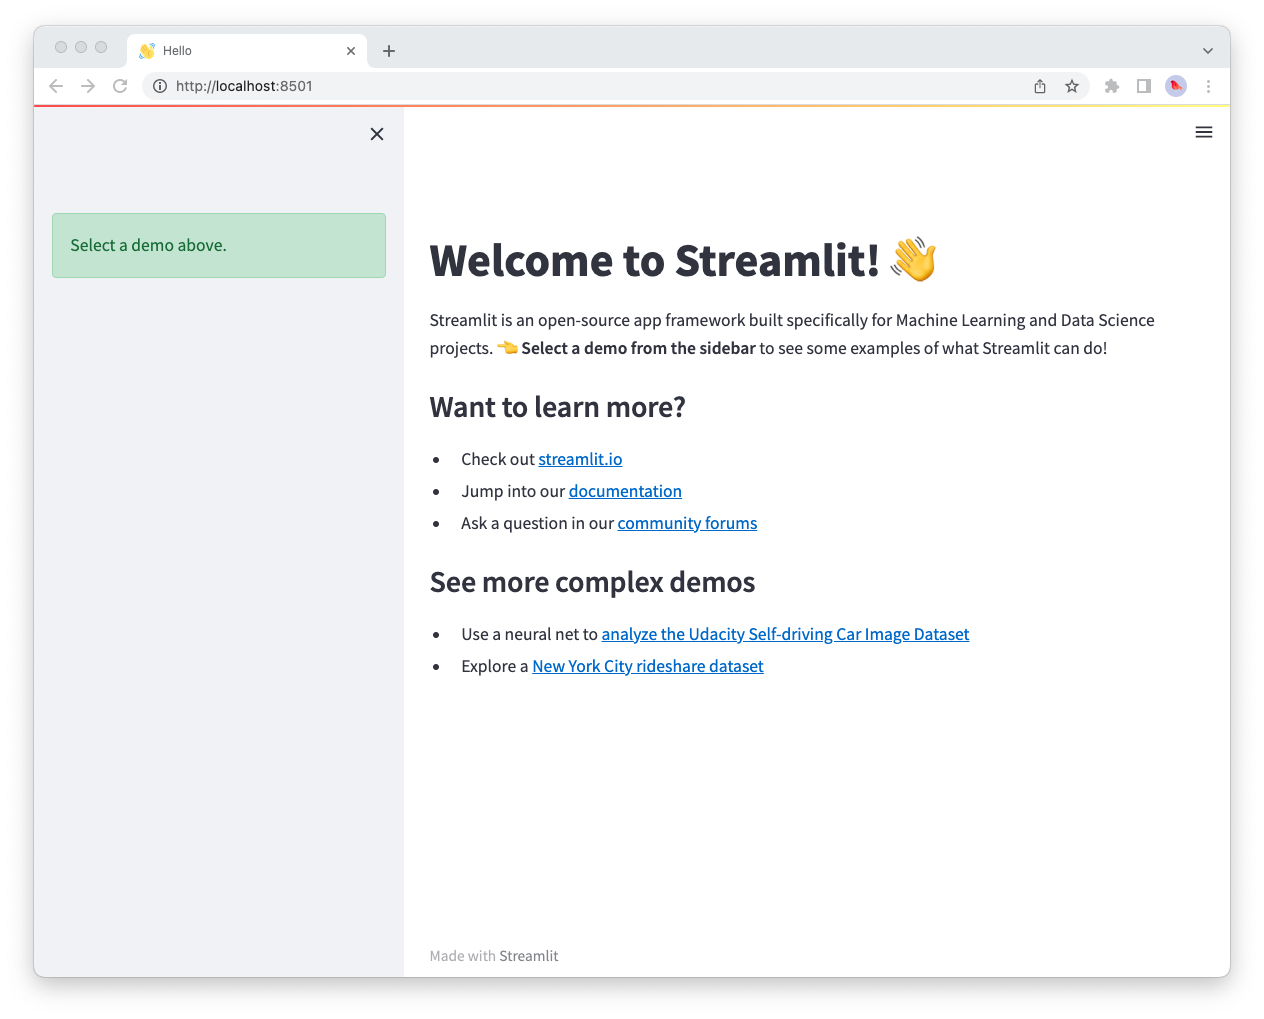
We rename our entrypoint file to Hello.py , so that the title in the sidebar is capitalized and only the code for the intro page is included. Additionally, we’re able to customize the page title and favicon — as it appears in the browser tab with st.set_page_config. We can do so for each of our pages too!

Notice how the sidebar does not contain page labels as we haven’t created any pages yet.
Create multiple pages
A few things to remember here:
- We can change the ordering of pages in our MPA by adding numbers to the beginning of each Python file. If we add a 1 to the front of our file name, Streamlit will put that file first in the list.
- The name of each Streamlit app is determined by the file name, so to change the app name you need to change the file name!
- We can add some fun to our app by adding emojis to our file names that will render in our Streamlit app.
- Each page will have its own URL, defined by the name of the file.
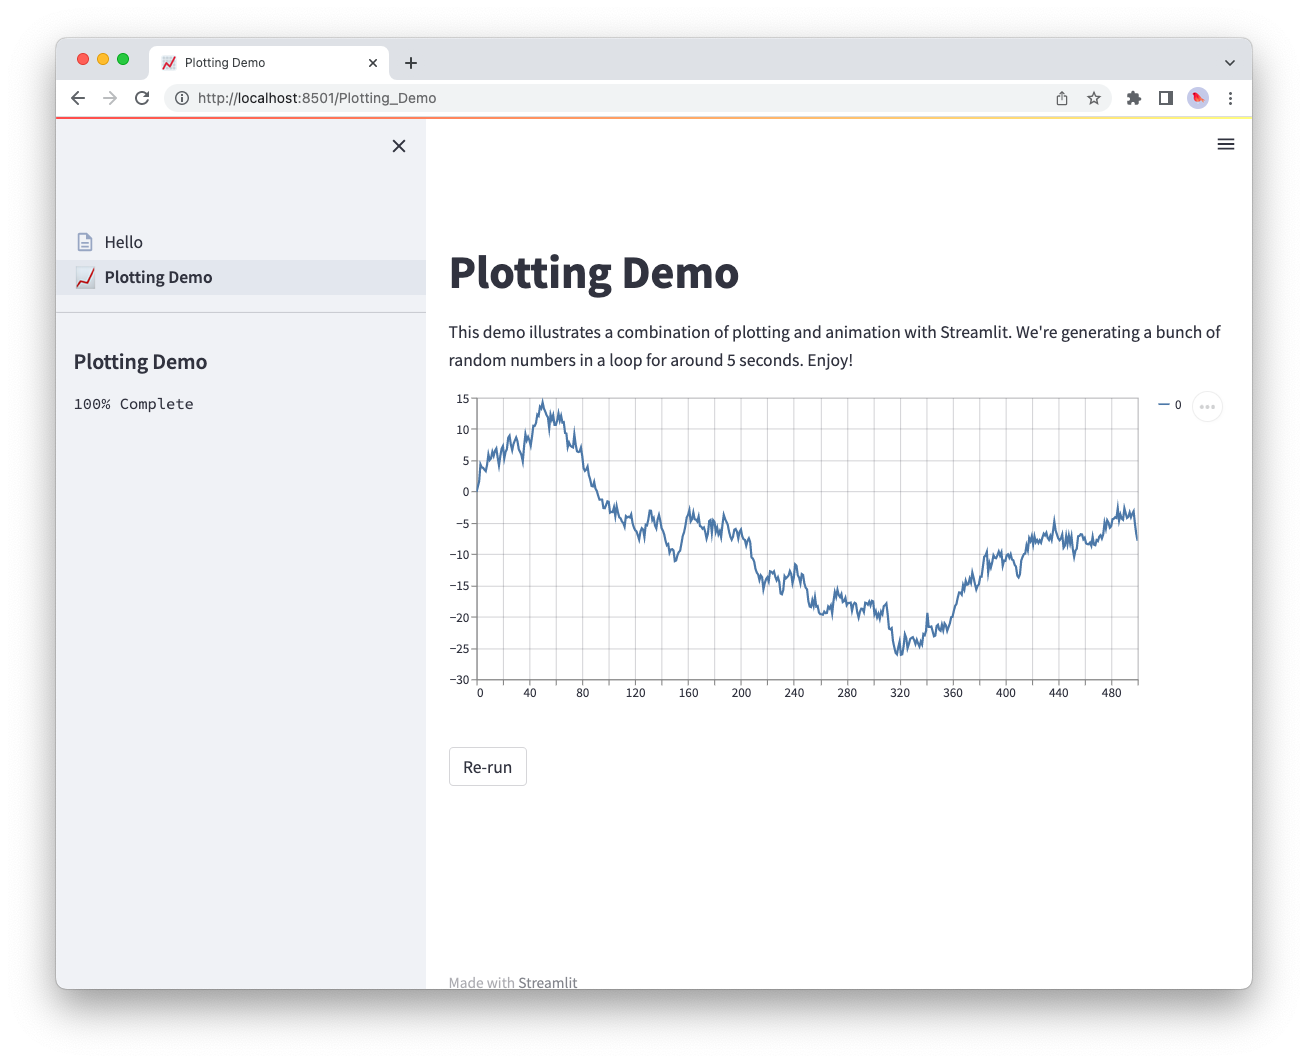
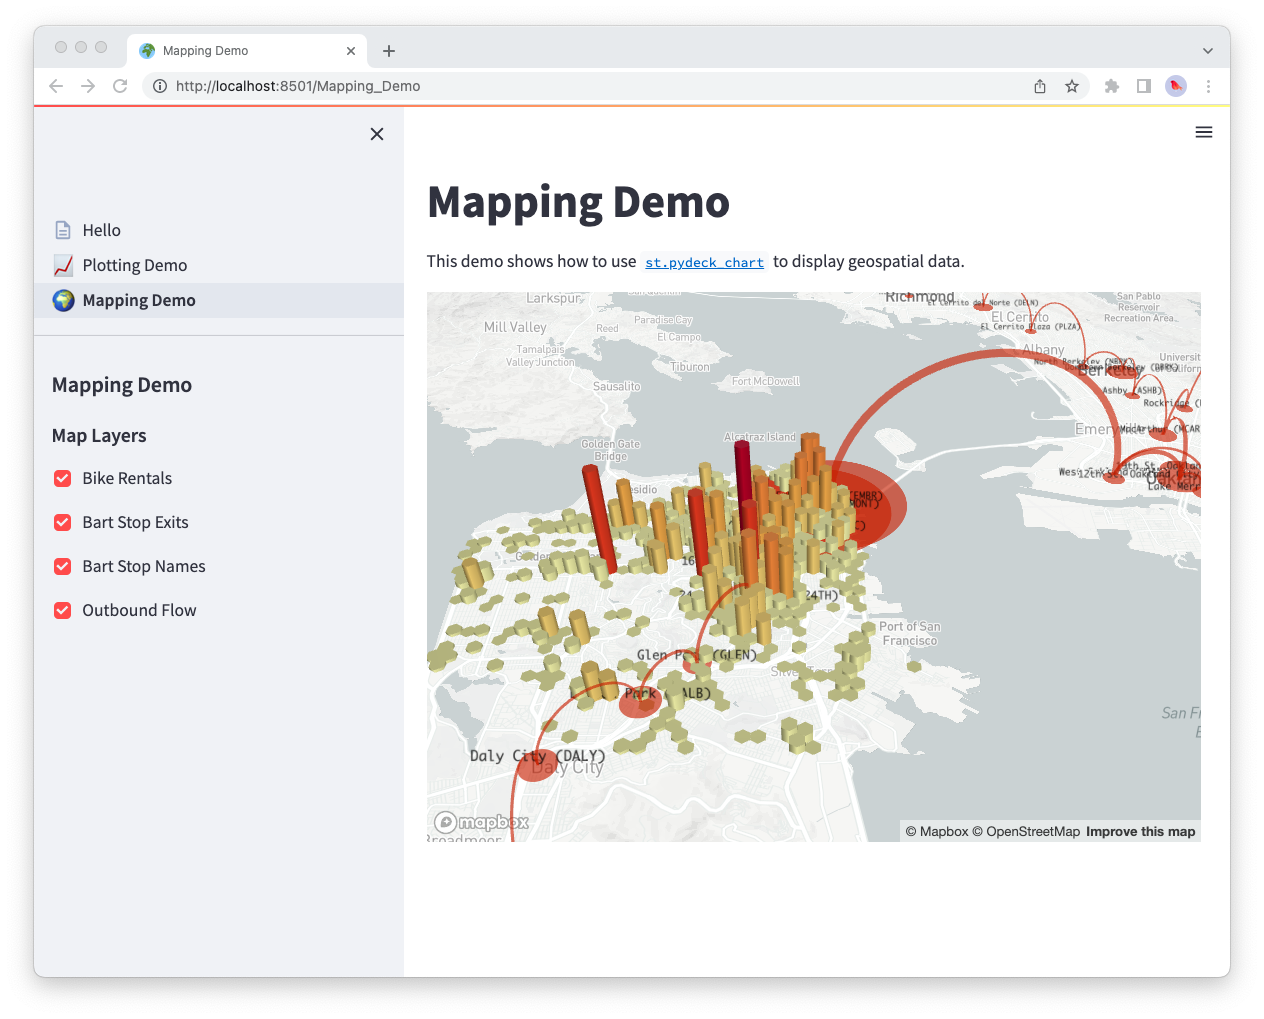
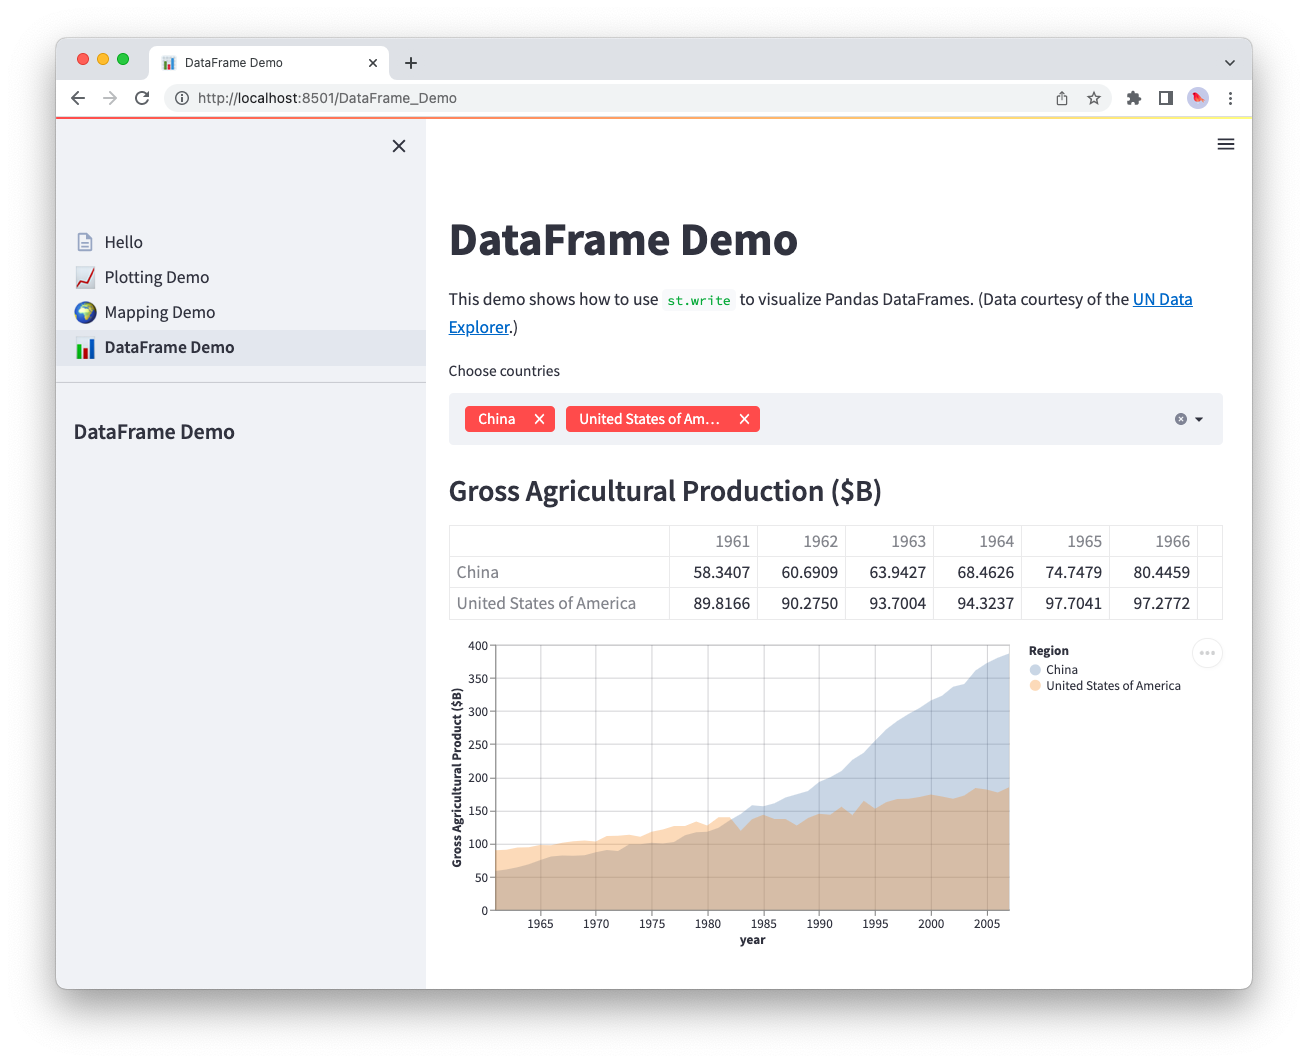
Check out how we do all this below! For each new page, we create a new file inside the pages folder, and add the appropriate demo code into it.
pages/1_📈_Plotting_Demo.py
import streamlit as st
import time
import numpy as np

st.set_page_config(page_title="Plotting Demo", page_icon="📈")

st.markdown("# Plotting Demo")
st.sidebar.header("Plotting Demo")
st.write(
    """This demo illustrates a combination of plotting and animation with
Streamlit. We're generating a bunch of random numbers in a loop for around
5 seconds. Enjoy!"""
)

progress_bar = st.sidebar.progress(0)
status_text = st.sidebar.empty()
last_rows = np.random.randn(1, 1)
chart = st.line_chart(last_rows)

for i in range(1, 101):
    new_rows = last_rows[-1, :] + np.random.randn(5, 1).cumsum(axis=0)
    status_text.text("%i%% Complete" % i)
    chart.add_rows(new_rows)
    progress_bar.progress(i)
    last_rows = new_rows
    time.sleep(0.05)

progress_bar.empty()

# Streamlit widgets automatically run the script from top to bottom. Since
# this button is not connected to any other logic, it just causes a plain
# rerun.
st.button("Re-run")

pages/2_🌍_Mapping_Demo.py
import streamlit as st
import pandas as pd
import pydeck as pdk
from urllib.error import URLError

st.set_page_config(page_title="Mapping Demo", page_icon="🌍")

st.markdown("# Mapping Demo")
st.sidebar.header("Mapping Demo")
st.write(
    """This demo shows how to use
[`st.pydeck_chart`](https://docs.streamlit.io/develop/api-reference/charts/st.pydeck_chart)
to display geospatial data."""
)


@st.cache_data
def from_data_file(filename):
    url = (
        "http://raw.githubusercontent.com/streamlit/"
        "example-data/master/hello/v1/%s" % filename
    )
    return pd.read_json(url)


try:
    ALL_LAYERS = {
        "Bike Rentals": pdk.Layer(
            "HexagonLayer",
            data=from_data_file("bike_rental_stats.json"),
            get_position=["lon", "lat"],
            radius=200,
            elevation_scale=4,
            elevation_range=[0, 1000],
            extruded=True,
        ),
        "Bart Stop Exits": pdk.Layer(
            "ScatterplotLayer",
            data=from_data_file("bart_stop_stats.json"),
            get_position=["lon", "lat"],
            get_color=[200, 30, 0, 160],
            get_radius="[exits]",
            radius_scale=0.05,
        ),
        "Bart Stop Names": pdk.Layer(
            "TextLayer",
            data=from_data_file("bart_stop_stats.json"),
            get_position=["lon", "lat"],
            get_text="name",
            get_color=[0, 0, 0, 200],
            get_size=15,
            get_alignment_baseline="'bottom'",
        ),
        "Outbound Flow": pdk.Layer(
            "ArcLayer",
            data=from_data_file("bart_path_stats.json"),
            get_source_position=["lon", "lat"],
            get_target_position=["lon2", "lat2"],
            get_source_color=[200, 30, 0, 160],
            get_target_color=[200, 30, 0, 160],
            auto_highlight=True,
            width_scale=0.0001,
            get_width="outbound",
            width_min_pixels=3,
            width_max_pixels=30,
        ),
    }
    st.sidebar.markdown("### Map Layers")
    selected_layers = [
        layer
        for layer_name, layer in ALL_LAYERS.items()
        if st.sidebar.checkbox(layer_name, True)
    ]
    if selected_layers:
        st.pydeck_chart(
            pdk.Deck(
                map_style="mapbox://styles/mapbox/light-v9",
                initial_view_state={
                    "latitude": 37.76,
                    "longitude": -122.4,
                    "zoom": 11,
                    "pitch": 50,
                },
                layers=selected_layers,
            )
        )
    else:
        st.error("Please choose at least one layer above.")
except URLError as e:
    st.error(
        """
        **This demo requires internet access.**
        Connection error: %s
    """
        % e.reason
    )

pages/3_📊_DataFrame_Demo.py
import streamlit as st
import pandas as pd
import altair as alt
from urllib.error import URLError

st.set_page_config(page_title="DataFrame Demo", page_icon="📊")

st.markdown("# DataFrame Demo")
st.sidebar.header("DataFrame Demo")
st.write(
    """This demo shows how to use `st.write` to visualize Pandas DataFrames.
(Data courtesy of the [UN Data Explorer](http://data.un.org/Explorer.aspx).)"""
)


@st.cache_data
def get_UN_data():
    AWS_BUCKET_URL = "http://streamlit-demo-data.s3-us-west-2.amazonaws.com"
    df = pd.read_csv(AWS_BUCKET_URL + "/agri.csv.gz")
    return df.set_index("Region")


try:
    df = get_UN_data()
    countries = st.multiselect(
        "Choose countries", list(df.index), ["China", "United States of America"]
    )
    if not countries:
        st.error("Please select at least one country.")
    else:
        data = df.loc[countries]
        data /= 1000000.0
        st.write("### Gross Agricultural Production ($B)", data.sort_index())

        data = data.T.reset_index()
        data = pd.melt(data, id_vars=["index"]).rename(
            columns={"index": "year", "value": "Gross Agricultural Product ($B)"}
        )
        chart = (
            alt.Chart(data)
            .mark_area(opacity=0.3)
            .encode(
                x="year:T",
                y=alt.Y("Gross Agricultural Product ($B):Q", stack=None),
                color="Region:N",
            )
        )
        st.altair_chart(chart, use_container_width=True)
except URLError as e:
    st.error(
        """
        **This demo requires internet access.**
        Connection error: %s
    """
        % e.reason
    )

With our additional pages created, we can now put it all together in the final step below.
Run the multipage app
To run your newly converted multipage app, run:
streamlit run Hello.py
That’s it! The Hello.py script now corresponds to the main page of your app, and other scripts that Streamlit finds in the pages folder will also be present in the new page selector that appears in the sidebar.
Next steps
Congratulations! 🎉 If you've read this far, chances are you've learned to create both single-page and multipage apps. Where you go from here is entirely up to your creativity! We’re excited to see what you’ll build now that adding additional pages to your apps is easier than ever. Try adding more pages to the app we've just built as an exercise. Also, stop by the forum to show off your multipage apps with the Streamlit community! 🎈
Here are a few resources to help you get started:
- Deploy your app for free on Streamlit's Community Cloud.
- Post a question or share your multipage app on our community forum.
- Check out our documentation on Multipage apps.
- Read through Concepts for things like caching, theming, and adding statefulness to apps.
- Browse our API reference for examples of every Streamlit command.
Still have questions?
Our forums are full of helpful information and Streamlit experts.